A Look at the Housing Market
Has the housing market reached its limits?
When you imagine a $2 million house, it’s probably big and fancy.
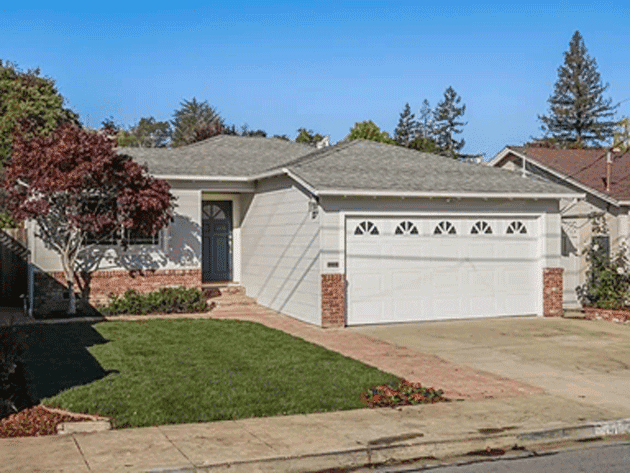
The house is just what it looks like: An ordinary 3-bedroom home. And it sold for $2.23 million in December 2021. This is the sort of astronomical price that has investors wondering if housing prices will crash like they did in 2007/2008.
We are certainly hearing echoes of the housing bubble. In the five years before the housing crash, US homes prices soared 60%, according to the S&P/Case-Schiller Home Price Index. In the past five years, housing prices have soared 51%.
The key difference is: This time there is no concrete catalyst to push housing prices lower.
When you imagine a $2 million house, it’s probably big and fancy.
Well, here’s what that kind of money gets you in a “middle class” suburb in the San Francisco Bay Area:

The house is just what it looks like: An ordinary 3-bedroom home. And it sold for $2.23 million in December 2021. This is the sort of astronomical price that has investors wondering if housing prices will crash like they did in 2007/2008.
We are certainly hearing echoes of the housing bubble. In the five years before the housing crash, US homes prices soared 60%, according to the S&P/Case-Schiller Home Price Index. In the past five years, housing prices have soared 51%.
The key difference is: This time there is no concrete catalyst to push housing prices lower.
The MBA Mortgage Application Index declined 8.1% last week, following the prior week's decrease of 1.2%. The downward move came as a 14.4% drop in the Refinance Index was accompanied by a 1.5% fall for the Purchase Index. The average 30-year mortgage rate extended its climb, jumping 23 basis points (bps) to 4.50%, and is up 114 bps versus a year ago.
In other housing news, new home sales fell 2.0% month-over-month (m/m) in February to an annual rate of 772,000 units, shy of the Bloomberg consensus forecast calling for a rate of 810,000 units, and below January's downwardly-revised 788,000-unit level.
That’s nearly double the pre-pandemic share. The biggest jump was in Anaheim, where 55% of homes were worth $1 million or more in February, up from 27% two years earlier. As expensive homes take up a larger chunk of the housing market, many Americans are getting priced out.
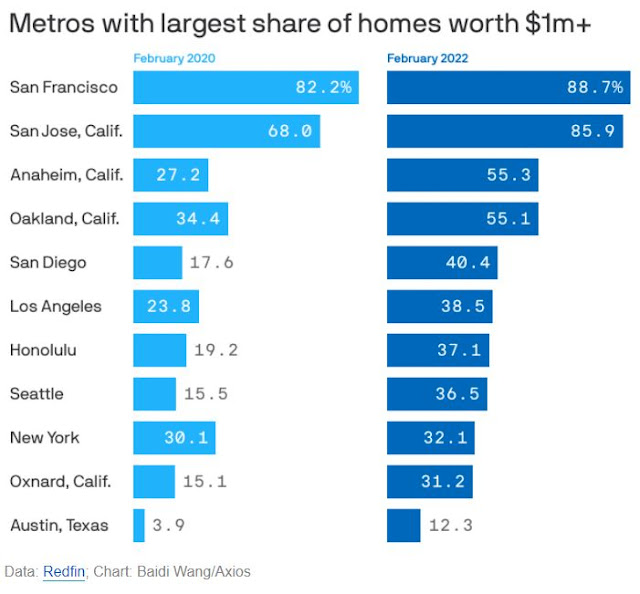
Nationwide, a record 8.2% of U.S. homes (6 million) were valued at $1 million or more in February. That’s up from 4.8% (3.5 million) two years earlier, just before the coronavirus was declared a pandemic. The Bay Area led the way, with nearly nine out of 10 properties in both San Francisco and San Jose falling into the $1 million-plus category. Meanwhile, the biggest increase was in Anaheim, CA, where the share of homes worth at least $1 million nearly doubled to 55%.
The number of Austin homes valued at more than $1 million tripled since before the pandemic — more than any other Texas city and a new record for the metro area.
State of play: The share of homes worth at least $1 million in the Austin metro sat at 3.9% in February 2020. That number has only grown, reaching 12.3% last month, per a new report from Redfin, the discount real estate brokerage.
It's a trend playing out across the country, with the percentage of U.S. homes valued at $1 million or more reaching a record high — a trend led by the Bay Area.
Seven of the top 10 cities with $1M+ homes are in California — led by San Francisco, where the percentage of properties worth that amount was a whopping 88.7% in February.
Why it matters: While rapidly appreciating home values are a windfall for those who own them, they also mean that more Americans are priced out of the market.
"During the four weeks ending Feb. 27, the number of homes for sale plummeted 50% from two years earlier to an all-time low of 456,000," Redfin says.
"That helped fuel a 33% rise in the median U.S. home-sale price, which hit a record high of $363,975," the company adds.
Details: Here's a selection of metro areas and their percentage of homes worth more than $1 million:
This analysis uses the Redfin Housing Value Index—a model that incorporates the Redfin Estimate, public records and MLS data to estimate the current and historical value of more than 85 million properties in the U.S. The figures in this report represent February 2022, unless otherwise noted. See the end of this report for a detailed methodology.
The median home price rose 10.7% y/y to $400,600. New home inventory rose to 6.3 months from January's level of a 6.1-months supply at the current sales pace.
Sales jumped m/m in the Northeast, and were higher in the Midwest, while lower in the South and West. Sales in all regions were lower y/y, except for the Northeast which gained ground.
New home sales are based on contract signings, offering a timelier read on housing activity compared to the larger contributor of existing home sales, which are based on closings.
A Record 8% of U.S. Homes Are Worth At Least $1 Million
Nationwide, a record 8.2% of U.S. homes (6 million) were valued at $1 million or more in February. That’s up from 4.8% (3.5 million) two years earlier, just before the coronavirus was declared a pandemic. The Bay Area led the way, with nearly nine out of 10 properties in both San Francisco and San Jose falling into the $1 million-plus category. Meanwhile, the biggest increase was in Anaheim, CA, where the share of homes worth at least $1 million nearly doubled to 55%.

The number of Austin homes valued at more than $1 million tripled since before the pandemic — more than any other Texas city and a new record for the metro area.
State of play: The share of homes worth at least $1 million in the Austin metro sat at 3.9% in February 2020. That number has only grown, reaching 12.3% last month, per a new report from Redfin, the discount real estate brokerage.
It's a trend playing out across the country, with the percentage of U.S. homes valued at $1 million or more reaching a record high — a trend led by the Bay Area.
Seven of the top 10 cities with $1M+ homes are in California — led by San Francisco, where the percentage of properties worth that amount was a whopping 88.7% in February.
Why it matters: While rapidly appreciating home values are a windfall for those who own them, they also mean that more Americans are priced out of the market.
Incomes are rising, but not as quickly as home prices — leaving many people stuck as renters.
Zoom out: That's deeply felt in Austin, which saw the second-highest increase over two years among non-California cities. Seattle was the only other non-California city to top Austin, with a 21% increase since February 2020.
Zoom out: That's deeply felt in Austin, which saw the second-highest increase over two years among non-California cities. Seattle was the only other non-California city to top Austin, with a 21% increase since February 2020.
- Dallas' share of $1M+ homes grew by 2.1 percentage points, reaching 4.4% last month.
- Houston saw a 1.3 percentage point increase, hitting 2.7% last month.
- And 1.5% of homes in San Antonio are more than $1 million, a 0.9 percentage point change.
"During the four weeks ending Feb. 27, the number of homes for sale plummeted 50% from two years earlier to an all-time low of 456,000," Redfin says.
"That helped fuel a 33% rise in the median U.S. home-sale price, which hit a record high of $363,975," the company adds.
Details: Here's a selection of metro areas and their percentage of homes worth more than $1 million:
- Albuquerque: 25%.
- Boston: 18.1%.
- Austin: 12.3%.
- Washington, D.C.: 10.9%.
- Denver: 9.7%.
- Phoenix: 7.8%.


Comments
Post a Comment
Thanks for the comment. Will get back to you as soon as convenient, if necessary.