Thursday, December 30, 2021

U.S. Home Prices Spiraling Out of Control
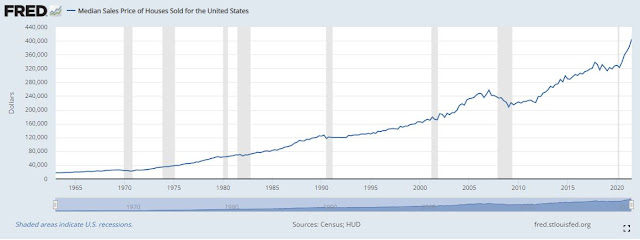
By Gary Halbert

U.S. home prices soared by 18.4% in October alone over year-ago levels. That was actually slightly below the annual increase of 19.1% in September. Home prices are on fire, and no one knows how this unprecedented bull market will end.

Here you can see what US home prices have done over the last 50+ years. The price rise has been spectacular, with no end in sight. Since the last low in 2010, median home prices have more than doubled from near $200,000 to above $400,000 today.


The median home sale price in the US was $404,700 at the end of the 3Q. It is considerably higher in certain popular zip codes. Those would include Phoenix, Tampa and Miami just to name a few. Minneapolis and Chicago posted the smallest increases over the past year but still increased by 11.5%.

The housing market has been strong thanks to rock-bottom mortgage rates, a limited supply of homes on the market and pent-up demand from consumers locked in last year by the pandemic. Many Americans, tired of being cooped up at home during the pandemic, are looking to trade up from apartments to homes or to bigger houses.

The great housing boom in the US continues unabated after eight years of strong house price growth. It has been buoyed not only by continued low interest rates but also by the government’s massive stimulus packages to cushion the impact of the pandemic. A limited supply of properties on the market has added to upward house price pressure.

House prices continue to rise strongly in all of the country’s 20 major cities, according to Standard and Poor’s, with Phoenix posting the highest increase of 32.41% year-over-year in July 2021, followed by San Diego (27.79%), Seattle (25.5%), Tampa (24.41%), Dallas (23.66%), Las Vegas (22.45%), Miami (22.23%), San Francisco (21.98%), Denver (21.31%) and Charlotte (20.89%).

Strong house price rises were also seen in Portland (19.54%), Los Angeles (19.12%), Boston (18.73%), Atlanta (18.48%), New York (17.86%), Cleveland (16.23%), Detroit (16.12%), Washington (15.84%), Minneapolis (14.56%) and Chicago (13.32%).

“Home price appreciation continues to escalate as millennials entering their prime home buying years, renters looking to escape skyrocketing rents and deep pocketed investors drive demand,” said Frank Martell, President and CEO of CoreLogic.

“On the supply side, it is also the result of chronic under building, especially of affordable stock. This lack of supply is unlikely to be resolved over the next 5 to 10 years without more aggressive incentives for builders to add new units.”

Will US homebuilders be able to keep up with demand? Probably not say most industry experts. US homebuilder sentiment stood at 76 in September 2021, up slightly from 75 in the previous month, according to the National Association of Home Builders (NAHB)/Wells Fargo Housing Market Index (HMI).

A reading of 50 is the midpoint between positive and negative. Sentiment stood at 83 in September 2020 and reached a record high of 90 in November. It then dropped dramatically in the following months, as lumber prices surged and supply chain disruptions hampered construction activity.

Interestingly, the home ownership rate rose significantly in 2020 despite the pandemic. In fact, it was the strongest growth rate since 2010. This is another factor which should keep support under home prices, at least for the near future. It will be interesting to see what happened in 2021 just ahead.

The question is, can this unprecedented housing market boom continue at this rate? The answer is probably not. That doesn’t mean it can’t go any higher before it slows down, but runaway bull markets like this don’t tend to end well. That remains to be seen, of course.

The last housing crash began in 2Q 2006. There was a 33.3% fall in the S&P/Case-Shiller composite-20 city home price index from 2Q 2006 to 4Q 2011. Phoenix registered the biggest drop (-54.7%) among the 20 largest metro areas, followed by Miami (-50.5%), Detroit (-43.3%), San Francisco (-40.8%), Los Angeles (-40.1%), and San Diego (-39.7%).

The US housing market started to recover in the second half of 2012. In 2013, the S&P/Case-Shiller composite-20 home price index soared 13.5%, then rose by 4.4% in 2014, 5.5% in 2015, 5.4% in 2016, 6.2% in 2017, 4% in 2018 and by 2.8% in 2019.

And despite the pandemic, the US housing market surprisingly continued its strong growth, with the S&P/Case-Shiller composite-20 home price index rising by a huge 22.7% in Jan 2020-Jul 2021. Phoenix led the boom, with house prices surging by 38.6% over the period.

The question of how long this boom in the US housing market will last is impossible to answer. A great deal depends on the health of the US economy. Right now, that looks pretty good. We just have to keep a close eye on things as we always do. I’ll keep you posted.

Friday, December 24, 2021

Outliers: How to Think About Success

From "Outliers: The Story of Success" by Malcolm Gladwell. 

Genius is not everything—emotional and practical intelligence are also critical to success

The man who invented the Intelligence Quotient (IQ) test was Lewis Terman, a professor of psychology at Stanford. His area of expertise was quantifying intelligence. In the early 1920s, he decided to dedicate his life to the study of singularly gifted kids. After a thorough vetting process through several rounds of tests given to elementary students in California, Terman selected a group of 1,470 children who had done brilliantly on the tests. The average IQ among the children was 140, and some had IQs as high as 200. He affectionately referred to these children as the “Termites,” and he dedicated his life to tracking their progress and life events.

IQ matters, clearly, but only up to a point. An IQ of 100 is average and above 145 is considered genius, but an adult with an IQ of 180 is not more or less likely to win a Nobel Prize than another adult with an IQ of 140. It is similar to basketball: The difference between five feet and six feet is much more significant than between seven feet and eight feet. After you are, say, six foot, six inches, you are “tall enough.” Similarly, beyond 120, there is not a significant measurable advantage that a higher IQ score brings. People with IQs of 125, 135, and 165 are all “smart enough.” A look at the universities that Nobel Laureates attended will show this to be the case—they did not all attend Ivy Leagues, but they went to schools that were “good enough.”

Another limitation of the IQ metric is its failure to consider the more creative, imaginative dimensions of human intelligence. In contrast to convergence tests like IQ and Raven’s Progressive Matrices, which test one’s ability to “converge” on the correct answer, divergence tests draw out the subjective, creative mental processes. Not just objective intelligence, but creativity and the ability to think beyond common categories are qualities needed to create the kind of groundbreaking, pioneering work that warrant a Nobel Prize.

In a related study, Terman examined the records of 730 of his Termites and divided them into three groups: the success stories, the average, and the unsatisfactory—or Group A, B, and C, respectively. He found that the most significant factor that separated the As from the Cs was family background. The vast majority of students from Group A were from stable, middle or upper class families with educated parents, whereas many from Group C had parents who were poor and did not make it to eighth grade. This powerfully showed that even brilliant individuals have a difficult time achieving success if they are bereft of the web of opportunities and advantages that a stable, educated family background brings.

For the aforementioned reasons, it is clear that Terman was mistaken in his understanding of the factors that lead to success. He overemphasized the objective, intellectual dimension of human existence when he gathered his Termites. Most of his Termites went on to live fairly conventional lives, earning decent incomes and holding respectable posts, but there were no Nobel Prize winners with earth-shattering ideas as he had hoped. Terman himself concluded that the link between intellect and achievement is not nearly as strong as he had supposed.

Cultures that reinforce the value of hard work produce better students.

Farming in the West is “mechanically oriented,” meaning bigger, more efficient machines yield better results. Asian agriculture, by contrast, is “skill oriented.” Given the limitations in land and capital for most Asians, long hours spent cultivating small plots as skillfully and efficiently as possible are the key to large harvests. Unlike other pre-modern lifestyles that are not as labor-intensive, rice farming in Asia often requires ten to twenty times more labor than a wheat field of the same size.

As with the Eastern European Jewish immigrants in New York working in the garment industry, Asian rice farmers are engaged in an occupation that meets the commonly accepted criteria for meaningful work: 1) the connection between hard work and reward is strong, 2) it is more than sufficiently complex, and 3) it is autonomous.

If we compare the folk proverbs of Russia and China, we find that the Russian peasants tended toward a passive, pessimistic fatalism, whereas the Chinese idioms were affirmations of the blood, sweat, and tears required for success. For example, “No one who can rise before dawn three hundred sixty days a year fails to make his family rich.” Hard work as critical to success is deeply ingrained in the Chinese psyche. The cultural patterns developed through attention to precision and unrelenting diligence in the rice paddies serves Asians well in many realms of life, but particularly in mathematics.

The average American high school student will spend about two minutes on a difficult problem before giving up on it. According to Berkley professor of mathematics Alan Schoenfeld, it is through persistence that one achieves breakthrough moments in learning math. Attitude is far more critical than aptitude.

We see this doggedness—and lack thereof—in the results of the TIMSS (Trends in International Math and Science Study) questionnaire. University of Pennsylvania professor Erling Boe found that he could accurately predict a country’s success based on how completely they filled out the grueling preliminary 120-item questionnaire. While many students around the world leave twenty or more questions unanswered, it should not surprise that Asians tend to fill out the surveys completely. Those countries with cultural legacies of single-minded determination, animated by sayings about rising before dawn everyday—those are cultures that are willing to complete exhausting surveys. They are also the same that excel in mathematics.

Thursday, December 23, 2021

Reasons people leave their states for others

Editor's Note: The majority of states that are losing residents are run by Democrats; the majority of states that are gaining residents are run by Republicans. In addition to states, if you research which large cities are also experiencing low or negative growth, you'll find cities like Portland, Seattle, New York, San Francisco, Los Angeles, Houston, etc., are also run by Democrats. Make of these facts as you wish, but to me it's obvious that what the left touches, the left destroys.)

Massachusetts (Democratic Governor, Republican Legislature)

People pay a premium to reside in Massachusetts, ranking sixth out of 52 regions on MERIC’s cost of living index. About 54.8% of all cross-border moves are outbound.

UebuNogami on Reddit offered one explanation for why Boston in particular is so expensive.

“There’s not enough housing to satisfy the demand. Unions make construction extremely expensive, and a requirement for the developer to give away a certain number of units for next to nothing makes building anything but luxury housing unprofitable.”

Michigan  (Democratic Governor, Republican Legislature)

Unemployment remains higher in Michigan than other states, and life can be hard even for people who do find a job. About 56.9% of all cross-border moves are outbound.

In a 2019 study, the Michigan Association of United Ways found that the number of households that can’t afford basic services is on the rise. Low wages are the norm, with most jobs paying less than $20 per hour.

“And the winters, oh god, the winters. They go on and on and on, and they are so dreary.”

Kansas (Democratic Governor, Republican Legislature)

As Dorothy said, “There’s no place like home,” but sentiment isn’t keeping people in Kansas. About 58.5% of all cross-border moves are outbound.

More than half shipped out for work, while retirement and family were each factors for a quarter of those who left. Though it’s cheap to live in Kansas and it’s not especially hard to find work, data from the Bureau of Labor Statistics (BLS) shows people earn about $6,000 less per year than the national average.

Lindsey Bugbee on Quora finds Western Kansas an insular place.

“Life is very slow-paced. People don’t pay attention to the world outside because Kansas is a perfect bubble of safety. In effect, some towns feel no need to distinguish themselves from other places.”

Connecticut (Democratic Governor, Democratic Legislature)

Some may know it as the Nutmeg State over tales of peddlers selling fake nutmeg in centuries past. But today, people in Connecticut are losing their money to the state’s over-the-top cost of living.

MERIC data shows everything is more expensive here, especially housing and utilities, so residents with mortgages would be well-advised to look into refinancing now while rates are dirt cheap.

And despite its seaside appeal, Connecticut doesn’t seem like it’s retaining its retirees. Almost 35% of the people who left wanted to retire somewhere else, competing with jobs for the No. 1 reason to move.

Another compelling reason: taxes. As in many states in the Northeast, residents can expect to lose a hefty chunk of their wealth to high income and sales tax.

Sixty-three percent of all cross-border moves are outbound.

New York (Democratic Governor, Democratic Legislature)

Living in New York City is an infamous challenge, as the median home costs over $1.6 million and rent will run you around $5,000 per month.

And it’s not just the Big Apple that will take a huge bite out of your paycheck. On a cost-of-living index created by the Missouri Economic Research and Information Center (MERIC), New York ranks fifth in the nation.

Taxes in particular are crippling. Between income, property and sales tax, you’ll lose more in New York than anywhere else.

About 63.1% of all cross-border moves are outbound.

Illinois (Democratic Governor, Democratic Legislature)

Still in the No. 2 spot following last year’s ranking, the Prairie State is known for Chicago, expansive farmland, the world’s largest bottle of catsup and high taxes.

A survey from NPR Illinois and University of Illinois Springfield saw 77% of respondents rate the economy as fair or poor. In the same survey, 3 out of 5 people said they’ve considered moving elsewhere, and taxes was the most common reason why.

Quora commenter Michael Kong suggested education is one reason taxes are so high.

“I can say it has something to do with supporting the local school system,” wrote Kong. “Every year I receive a letter explaining where my property tax goes into. From the letter, I can see about $8,000 goes to the public school system, and another $2,000 goes to the community college.”

About 66.5% of all cross-border moves are outbound.

New Jersey (Democratic Governor, Democratic Legislature)

The grass is always greener outside the Garden State, as New Jersey retains its No. 1 spot from last year’s list. A whopping 68.5% of all cross-border moves are outbound.

Jersey has been one of the top 10 move-out states for United Van Lines for more than a decade. Jobs and retirement are equally likely to send people packing.

Taxes could be a major culprit — New Jersey has some of the highest in the country — though Reddit’s bjorn2bwild says just about everything is incredibly expensive.

“We have high property taxes if you want to live in a decent area. School districts are very closely tied to municipalities, so if you want your kids to go to a good school, prepare to pay for it. Auto insurance, tolls, most goods and services are all very high.”

California (Democratic Governor, Democratic Legislature)

The Golden State was new to the top 10 in the latest United Van Lines survey. About 56.9% of all cross-border moves are outbound.

While work was the No. 1 reason to leave California, it was an even bigger reason to come. The land of Hollywood and Silicon Valley has an irresistible appeal.

However, the glamor comes with a price. California is the third most expensive place to live in the United States, beaten only by the District of Columbia and Hawaii on MERIC’s list.

Housing is particularly pricey, and depending on where you live, there’s always the chance your hard-earned property will be consumed by one of the state’s many wildfires.

Wednesday, December 22, 2021

U.S. equities finish higher to extend yesterday's gains

U.S. equities finished higher to extend yesterday's gains, after a better-than-expected Consumer Confidence report showed increasing optimism. Despite the improved outlook, investors continued to grapple with the uncertainties surrounding the omicron variant and its economic impact. 

President Biden spoke on COVID yesterday afternoon, announcing plans to distribute free at-home COVID testing kits and dispatch 1,000 members of the military to support hospitals, while avoiding any mention of lockdowns. 

In other economic news, existing home sales rose for the third consecutive month, albeit at a smaller-than-expected pace, Q3 GDP was revised slightly higher and mortgage applications declined. On the equity front, Pfizer’s Paxlovid oral pill was granted an emergency use authorization by the U.S. Food and Drug Administration (FDA) for treatment of COVID-19 disease in high-risk adults and pediatric patients, 

CarMax posted upbeat quarterly results on record auto sales, while BlackBerry broke even for the quarter, but disappointed the Street with its guidance. Treasuries were mixed, and the U.S. dollar dipped, while crude oil prices were higher, and gold advanced. Europe finished broadly higher and Asia mostly advanced.

The Dow Jones Industrial Average increased 261 points (0.7%) to 35,754, the S&P 500 Index rose 47 points (1.0%) to 4,697, and the Nasdaq Composite gained 181 points (1.2%) to 15,522. In lighter volume, 3.2 billion shares of NYSE-listed stocks were traded, and 4.0 billion shares changed hands on the Nasdaq. 

WTI crude oil moved $1.64 higher to $72.76 per barrel. Elsewhere, the gold spot price gained $16.30 to $1,805.00 per ounce, and the Dollar Index—a comparison of the U.S. dollar to six major world currencies—was 0.5% lower at 96.04.

Monday, December 20, 2021

Holiday-Shortened Week Begins with Losses

U.S. equities began the holiday-shortened week on a down note, as uncertainty regarding the ultimate impact of the omicron variant persists. All the major sectors were in the red, led by Financials, Consumer Discretionary and Information Technology, while Health Care issues were also lower despite Moderna's announcement of positive results of its COVID booster against omicron. 

The markets also grappled with dampened expectations (in my opinion, this should be positive) regarding the passing of President Biden's social spending and climate plan after Democratic senator Joe Manchin said he won't support the bill. 

In economic news, leading indicators accelerated more than expected and posted the ninth-straight monthly gain. In other equity news, Oracle Corporation confirmed last week's reports that it agreed to acquire Cerner Corporation for an equity value of $28.3 billion. 

Treasuries were mixed, and the U.S. dollar was little changed, while crude oil prices tumbled, and gold fell. Markets in Europe and Asia also finished with widespread losses.

The Dow Jones Industrial Average decreased 433 points (1.2%) to 34,932, the S&P 500 Index declined 53 points (1.1%) to 4,568, and the Nasdaq Composite shed 189 points (1.2%) to 14,981. In heavy volume, 4.5 billion shares of NYSE-listed stocks were traded, and 4.4 billion shares changed hands on the Nasdaq. WTI crude oil fell $2.11 to $68.61 per barrel. 

Elsewhere, the gold spot price lost $14.80 to $1,790.10 per ounce, and the Dollar Index—a comparison of the U.S. dollar to six major world currencies—was nearly flat at 96.53.

NASDAQ 100 Index Daily Chart
NASDAQ 100 Index Daily


Saturday, December 18, 2021

Storm Shelters back in vogue after prediction of 2,700 mph winds


But...but...but I read in Newsweek that Tornados will be 9 times more strong by 2099. NINE TIMES STRONGER. Can you image a 'tornader' with winds of 2,700 mph? Neither can anyone else. 


Thursday, December 16, 2021

Conviction Wanes Amid Continued Variant Uncertainty

The bulls' attempt to extend yesterday's rally that was sparked by the Fed's decision to speed up the tapering of its asset purchases fell short, as U.S. equities did an about-face to finish lower amid continued worries over the omicron variant. 

The markets also digested monetary policy decisions out of Europe, with the European Central Bank temporarily increasing its asset purchases and the Bank of England unexpectedly raising its benchmark interest rate. 

Investors also sifted through a host of economic data that showed jobless claims modestly bounced off multi-decade lows, housing construction activity came in stronger than expected, manufacturing and services sector growth decelerated, and industrial production rose at a slightly smaller pace than anticipated. 

In equity news, Lennar Corporation and Adobe traded lower following their earnings reports, while Accenture rallied in the wake of its earnings results and guidance. 

Treasuries were mixed and the U.S. dollar fell, while gold jumped, and crude oil prices also gained ground. Europe finished with widespread gains, and markets in Asia were mostly higher.


Stocks Mixed as Markets Digest Data and Monetary Policy Decisions

Treasuries are mixed after seeing some pressure yesterday as the Federal Reserve expectedly announced that it will speed up the tapering of its monthly asset purchases. The yield on the 2-year note is declining 6 basis points to 0.61%, and the yield on the 10-year note is decreasing 3 bps to 1.43%, while the 30-year bond rate is ticking 1 basis point higher to 1.87%.

Many stocks are up today as well.  Why? First of all, the market loves certainty. Knowing what to expect on the macroeconomic level next year goes a long way for investors that are closely watching their portfolios, as well as an assurance from the Fed that it is taking inflation seriously. Powell also balanced his rates outlook with a strong dose of optimism about demand and income, and confirmed that "we're making rapid progress toward maximum employment."

Weekly initial jobless claims came in at a level of 206,000 for the week ended December 11, versus the Bloomberg consensus estimate of 200,000 and compared to the prior week's upwardly-revised 188,000 level, which was the lowest in 52 years. The four-week moving average fell by 16,000 to 203,750, and continuing claims for the week ended December 4 dropped by 154,000 to 1,845,000, south of estimates of 1,943,000. The four-week moving average of continuing claims fell by 66,000 to 1,963,250.

Housing starts for November rose 11.8% month-over-month (m/m) to an annual pace of 1,679,000 units, above forecasts of 1,567,000 units, and compared to October's downwardly-revised pace of 1,502,000 units. Also, building permits, one of the leading indicators tracked by the Conference Board as it is a gauge of future construction, advanced 3.6% m/m at an annual rate of 1,712,000, north of expectations calling for 1,661,000 units, and compared to the upwardly-revised 1,653,000 unit pace in October.


Tuesday, December 14, 2021

Proper way to calculate CAGR using T-Sql for SQL Server

After reading (and attempting the solutions offered in some) several articles about SQL and CAGR,  I have reached the conclusion that none of them would stand testing in a real-world environment. For one thing, the SQL queries offered as examples are overly complex or don't use the correct math for calculating proper CAGR. Since most DBAs don't have an MBA or Finance degree, let me help. 

The correct equation for calculating Compound Annual Growth Rate (as a percentage) is: 


Some key points about CAGR: 
  • The compounded annual growth rate (CAGR) is one of the most accurate ways to calculate and determine returns for anything that can rise or fall in value over time.
  • Investors can compare the CAGR of two alternatives to evaluate how well one stock performed against other stocks in a peer group or a market index.
  • The CAGR does not reflect investment risk.
You can read a full article about CAGR here

To calculate the CAGR for an investment in a language like VB is pretty straightforward.

Dim CAGR as Decimal = ((MarketValue / Basis) ^ (1 / (DaysHeld / 365)) - 1). 

The MarketValue is the ending value, and this can be calculated as the number of shares times last share price. Basis is simply the dollar amount paid for the investment. Because the formula is expecting N to be number of years, I use the DATEDIFF function to get the actual number of days I've held the investment, then divide by 365. I do not multiple by 100, because I'll format this result as a Percentage, by using either the FormatPercent function, or the DataFormatString="{0:P2} attribute in the GridView's BoundField.

In a SQL query, you have to use the POWER function to raise the overall return rate to the exponent of 1/n. This can get a little complicated with the use of parenthetical brackets to ensure the correct outcome. 

For this example, there will be two tables, called Stocks and StockPrices. Stocks will have fields named StockID, Symbol, DatePurchased, SharesHeld (among others), and StockPrices will have StockID, QuotedDate, and StockPrice.

Here's how the query works out: 

SELECT s.symbol, s.DatePurchased, sp.stockprice, s.sharesheld,  s.basis,

/* This is the statement for CAGR */
(Power(((sp.stockprice * s.SharesHeld) / s.Basis), 1 / (Cast(DATEDIFF(DAY,s.DatePurchased,getDate()) as float) / 365))-1) as 'CAGR'

FROM tblStocks s, tblStockPrices sp WHERE s.stockid = sp.stockid 
AND sp.quotedate = (select max(quotedate) from tblStockPrices) 
order by s.Symbol

Again, I've omitted the multiplication by 100 because I'll format the result as a percentage when I render it to the web page. 

Monday, December 13, 2021

Getting the text of a GridView HyperLink Bound Field

It's quite common to do some extra processing of data during a GridView's Row_DataBound event. You can normally capture the value of the GridView cell like this, which would capture the value of the 3rd column in the grid (row count is 0 based). 

If e.Row.RowType = DataControlRowType.DataRow Then

    Dim Value as String = CType(e.row.cells(2).Text, String)

    'some manipulation of cell data, such as formatting, etc.

    e.row.cells(2).Text = NewValue

End If

This works well if the field is configured as a BoundField: 

<asp:BoundField DataField="DataBaseFieldValue" HeaderText="Field Name" />

But if the field is configured like this, as a HyperLink field, then you must get to its value differently:

<asp:HyperLinkField DataTextField="Symbol" HeaderText="Symbol" DataNavigateUrlFields="StockID"  DataNavigateUrlFormatString="EditStock.aspx?id={0}&ref=pp" SortExpression="s.symbol" />

This assumes that the field you're looking for is the first column of the GridView control. 

If e.Row.RowType = DataControlRowType.DataRow Then

    Dim HyperLinkText as String = DirectCast(e.Row.Cells(0).Controls(0), HyperLink).Text

    Dim HypLinkURL as string = DirectCast(e.Row.Cells(0).Controls(0), HyperLink).NavigateUrl

    'Do something with the values

End If

Saturday, December 11, 2021

Wokeism to Depotism: What's Going On?

Woke Got What It Wanted

By Victor David Hanson
Stanford University

The “woke” movement was giddy after Jan. 20, 2021. The left controlled both houses of Congress.President Joe Biden was drafted as the necessary veneer of 1980s Democratic normality to ram through an otherwise hard-left agenda.

All the major cultural, financial, economic, entertainment, and media institutions had played various roles in seeing former President Donald Trump not just defeated, but also impeached, twice. He was written off as persona non grata after the Jan. 6 riot at the Capitol.

So, academia, corporate boardrooms, Hollywood, the media, the Pentagon, professional sports teams, Silicon Valley, and Wall Street in near hysterical fashion all boarded the woke train. All boasted of ferreting out “white rage” and hiring legions of “diversity, equity, and inclusion” czars.


Reducing a Great Republic to Despotism

By Larry P. Arnn
Hillsdale College

Listen to Fauci on Face the Nation, dismissing his critics in Congress as backward reactionaries. When those critics disagree with him, Fauci said recently, “They’re really criticizing science because I represent science. That’s dangerous.”

The problem with this kind of thinking was pointed out by a young Winston Churchill in a letter to the writer H.G. Wells in 1901. Churchill wrote:

"Nothing would be more fatal than for the government of states to get into the hands of the experts. Expert knowledge is limited knowledge: and the unlimited ignorance of the plain man who knows only what hurts is a safer guide, than any vigorous direction of a specialised character. Why should you assume that all except doctors, engineers, etc. are drones or worse? . . . If the Ruler is to be an expert in anything he should be an expert in everything; and that is plainly impossible."

Friday, December 10, 2021

Inflation: Fed totally missed the mark on its transitory view

The Consumer Price Index (CPI) rose 0.8% month-over-month (m/m) in November, just above the Bloomberg consensus estimate of a 0.7% increase, and following October's unrevised 0.9% gain. The core rate, which strips out food and energy, increased 0.5% m/m, in line with forecasts, after October's unadjusted 0.6% rise. Y/Y, prices were 6.8% higher for the headline rate—the fastest pace since 1982—matching estimates, and following the prior month's 6.2% increase. The core rate was up 4.9% y/y, in line with projections, and following October's unrevised 4.6% increase.


Key Factors

  • The food index was up 0.7% month-over-month. On an unadjusted basis, the food index was up 6.1% year-over-year.
  • The energy index was up 3.5% month-over-month. On an unadjusted basis, the energy index was up 33.3% year-over-year.
  • The shelter index was up 0.5% month-over-month. On an unadjusted basis, the shelter index was up 3.8% year-over-year (which many observers think is grossly understated).
  • The used cars and trucks index was up 2.5% month-over-month. On an unadjusted basis, the used cars and trucks index was up 31.4% year-over-year.
  • The apparel index was up 1.3% month-over-month. On an unadjusted basis, the apparel index was up 5.0% year-over-year.

Big Picture

  • There isn't just one key takeaway from this report. There are many:
  • The Fed totally missed the mark with its transitory inflation view.
  • The inflation data make it clear that the Fed is going to announce a more aggressive tapering path at next week's FOMC meeting.
  • These data should stir concerns about a third rate hike being in the mix for 2022.
  • Inflation pressures are broad based.
  • Nominal wage gains will be undercut by inflation that will limit real spending growth potential.
  • The elevated inflation print will stand as a political pressure point.

Sunday, November 14, 2021

Inflation: Here's what's becoming more expensive

With inflation running hot in October, American consumers paid slightly more for most goods and services compared to the previous month, and far more compared to a year ago.

The Labor Department’s consumer price index (CPI), a key inflation gauge that measures how much Americans pay for goods and services, rose 0.9 percent over the month in October and 6.2 percent over the year, with the annual figure reflecting the highest pace of price hikes in nearly 31 years.

The agency’s report (pdf), released Nov. 10, breaks down how much prices have increased for certain key services and goods, including gas, food prices, electricity, and used cars. Seasonally adjusted figures are only available for the month-over-month comparison, while seasonally unadjusted data is available in both over-the-year and over-the-month formats.

Gasoline: 49.6 percent year-over-year and 3.7 percent month-over-month seasonally unadjusted; 6.1 percent month-over-month, seasonally adjusted

Fuel oil: 59.1 percent year-over-year and 12.3 percent month-over-month seasonally unadjusted; 12.3 percent month-over-month, seasonally adjusted

Electricity: 6.5 percent year-over-year and minus 0.1 percent month-over-month seasonally unadjusted; 1.8 percent month-over-month, seasonally adjusted

Utility (piped) gas service: 28.1 percent year-over-year and 6.5 percent month-over-month seasonally unadjusted; 6.6 percent month-over-month, seasonally adjusted

Propane, kerosene, and firewood: 34.7 percent year-over-year and 7.9 percent month-over-month seasonally unadjusted; 6.2 percent month-over-month, seasonally adjusted

Food: 5.3 percent year-over-year and 1.0 percent month-over-month seasonally unadjusted; 0.9 percent month-over-month, seasonally adjusted

Meats, poultry, fish, and eggs: 11.9 percent year-over-year and 1.4 percent month-over-month seasonally unadjusted; 1.7 percent month-over-month, seasonally adjusted

Bacon and similar products: 20.2 percent year-over-year and 2.1 percent month-over-month seasonally unadjusted; 2.0 percent month-over-month, seasonally adjusted

Pork chops: 15.9 percent year-over-year and 5.0 percent month-over-month seasonally unadjusted; 5.0 percent month-over-month, seasonally adjusted

Uncooked beef steaks: 24.2 percent year-over-year and 1.9 percent month-over-month seasonally unadjusted; 1.7 percent month-over-month, seasonally adjusted

Peanut butter: 6.0 percent year-over-year and 3.3 percent month-over-month seasonally unadjusted; 3.3 percent month-over-month, seasonally adjusted

Coffee: 4.7 percent year-over-year and 1.7 percent month-over-month seasonally unadjusted; 2.8 percent month-over-month, seasonally adjusted

Restaurant prices: 5.3 percent year-over-year and 0.8 percent month-over-month seasonally unadjusted; 0.8 percent month-over-month, seasonally adjusted

Furniture and bedding: 12.0 percent year-over-year and 0.3 percent month-over-month seasonally unadjusted; 0.3 percent month-over-month, seasonally adjusted

Sporting goods: 8.7 percent year-over-year and 1.6 percent month-over-month seasonally unadjusted; 1.6 percent month-over-month, seasonally adjusted

Appliances: 6.6 percent year-over-year and minus 0.2 percent month-over-month seasonally unadjusted; minus 0.1 percent month-over-month, seasonally adjusted

Used cars and trucks: 26.4 percent year-over-year and 1.4 percent month-over-month seasonally unadjusted; 2.5 percent month-over-month, seasonally adjusted

New cars and trucks: 9.8 percent year-over-year and 2.6 percent month-over-month seasonally unadjusted; 1.4 percent month-over-month, seasonally adjusted

Motor vehicle maintenance and repair: 5.4 percent year-over-year and 1.5 percent month-over-month seasonally unadjusted; 1.5 percent month-over-month, seasonally adjusted

Delivery services: 7.5 percent year-over-year and 0.4 percent month-over-month seasonally unadjusted; 0.7 percent month-over-month, seasonally adjusted

Rent: 2.7 percent year-over-year and 0.5 percent month-over-month seasonally unadjusted; 0.4 percent month-over-month, seasonally adjusted

Lodging away from home: 22.3 percent year-over-year and minus 3.2 percent month-over-month seasonally unadjusted; 1.4 percent month-over-month, seasonally adjusted

Wednesday, November 10, 2021

Inflation Still Hot. Doesn't Look Very "Transitory"

Six months ago, any inflation was supposed to be transitory, meaning just temporary. But it seems to persist. I also think it's very strange that the government also reports inflation minues "food and energy." Do these people not live in the real world? Anyone know of a family budget that doesn't have a large part taken by "food and energy?" Anyway, I digress.

The Consumer Price Index (CPI) rose 0.9% month-over-month (m/m) in October, above the Bloomberg consensus estimate of a 0.6% increase. The core rate, which strips out food and energy, increased 0.6% m/m, above the 0.4% expected, and following September's unadjusted 0.2% rise. Y/Y, prices were 6.2% higher for the headline rate, north of forecasted 5.9% rise and the quickest acceleration in 30 years. The core rate was up 4.6% y/y, above the projected 4.3% gain and August's unrevised 4.0% increase.

The Bureau of Labor Statistics (BLS) said that the monthly all-items increase was broad based, and the components for energy, shelter, food, used cars and trucks, and new vehicles were among the larger contributors. Energy rose 30.0% over the last 12 months, and food increased 5.3%.

Wednesday, October 20, 2021

Right-to-Work; Energy Crisis; Caving to Unions; Weaponizing the IRS

Buried in the Budget Reconciliation Is the End of Right-to-Work, Independent Contractors; Climate Change

Among the various major provisions of the PRO Act is effective nationalization of California's AB5 law that passed in 2019. This law makes hiring independent contractors much more difficult and specifies that contractors must be reclassified by businesses that hire them as employees, unless they meet specific and rigorous standards allowing them to stay independent. Read full article...

Biden on Energy Crisis: Begging Others to Save Him From Himself

It is on the costs of energy where Biden’s failures are most starkly visible.

On his very first day in office, Biden scrapped the Keystone XL pipeline, killing 11,000 jobs in the process and making good on his campaign promise to be hostile to the fossil fuel industry.

Continuing his assault on natural resource development, Biden suspended oil and natural gas leases in Alaska.

Former President Donald Trump had propelled America to energy independence, but Biden has purposely squandered it. His policies are designed to reduce domestic production of petroleum, meaning we have become necessarily more reliant on foreign sources.

Biden’s approach has been an economic disaster.

According to The Wall Street Journal, the price of crude oil has jumped by 64% to a seven-year high. The cost of natural gas has doubled in just six months. Heating oil is more expensive by 68%, just in time for winter. And gasoline is over $3 per gallon on the national average, up by almost a dollar over the past year. Read full article...

Biden Caves To Unions Again, Sabotaging Consumers

Here's the biggest lie, straight from Transportation Secretary Pete Buttigieg. He went on parental leave in August, ignoring the worsening supply crisis. But he emerged from diaper duty long enough on Sunday to shovel some grown-up manure. Buttigieg said dysfunctional ports are "one more example of why we need to pass the infrastructure bill."

In truth, the $17 billion for ports in the infrastructure bill is mostly for emissions reductions, repairs and dredging. Nothing is allocated for labor-saving automation. In fact, section 30102 of Biden's Build Back Better Bill expressly prohibits the use of funds provided there to be used for automation. Read full article.

What’s Inside Democrats’ 2,465-Page $3.5 Trillion Spending Bill?

Democrats’ $3.5 trillion spending package gives the IRS permission, and funding, to snoop on nearly every American’s bank account, Jessica Anderson, executive director of Heritage Action for America, says.

The “Biden administration is asking Congress to go … weaponize the IRS to spy on Americans,” Anderson says.

The future of the bill is unclear after Sen. Joe Manchin, D-W.Va., said he could not support a spending bill over $1.5 trillion. Anderson joins “The Daily Signal Podcast” to discuss how likely it is for the bill to move forward in Congress and what we know about the provisions in the package. Read full article.

Global Warming on Pause? 


Monday, October 18, 2021

Democrat's destructive spending spree would turn America into European Social Welfare State

One of the current issues facing the U.S. economy is more demand than supply can keep up with. Part of the issue has been government programs that have incentivized workers to stay home, and the result is a labor shortage and a record number of job openings, while the workforce participation rate drops to the lowest in decades. 

In the meantime, Democrats on Capitol Hill have been busily working on a new spending package. 

The cradle-to-grave subsidies in the 2,448-page, $3.5 trillion spending bill that Democrats in Congress are crafting will create a welfare trap for millions more Americans, send inflation soaring, and drive our nation much deeper into debt.

Economic policy professor Chuck Blahous of the Mercatus Center at George Mason University analyzed the health benefit proposals in the spending bill. He wrote that expanding Medicare, Medicaid, and “so-called Obamacare” will “represent a major escalation of the fiscal irresponsibility lawmakers have practiced for the past several years.”

Former White House chief economist Casey Mulligan, now a professor at the University of Chicago, wrote that the spending bill would “implement the single largest permanent increase in work disincentives since the income tax came into its own during World War II.”

“The implicit employment and income taxes in [this legislation] would increase marginal tax rates on work by about 7 percentage points,” he wrote. “I expect that such a change in the disincentive would reduce full-time equivalent employment by about 4.5%, or about 7 million jobs.”

University of Chicago professor Charles Lipson wrote in “It’s Not the Top-Line Number—It’s the Bottom-Line Goal” that the spending bill would fundamentally transform the United States into a European social welfare state.

“Progressives know—and the whole country should understand—that piling on these vast new programs would be a major step in turning the United States into a European-style social democracy, along the lines of France, Germany, Spain, or Italy,” Lipson wrote. “Voters never elected [Joe] Biden to do that.”
--------------------------------------
…the House reconciliation bill would let the Internal Revenue Service peer into the bank account of virtually every American. …Here’s the proposition: You permanently sacrifice your financial privacy, and the Democrats get a small step closer to funding their agenda. …Treasury secretary Janet Yellen claims the IRS will overcome perennial bureaucratic incompetence and track down “opaque income streams that disproportionately accrue to the top.” …If it’s high earners we’re worried about, why spy on everyone? …The administration is seriously arguing for a new oversight regime that would gather data on nearly every American on the off chance that a billionaire opens several thousand bank accounts. …this move on bank accounts would represent a new, jaw-dropping level of federal intrusiveness and is a power no government should have. Biden officials from Yellen on down have had trouble defending it — because it is literally indefensible. -- National Review
----------------------------------------
The legislation is so huge and complex that even the Congressional Budget Office says “it is unclear” when it will be able to estimate the cost of the full spending bill, which is itself a moving target.

Congressional Budget Office Director Phillip Swagel wrote in a letter to Senate Minority Leader Mitch McConnell, R-Ky., last week, “The agency has not estimated how the entire package would affect direct spending, revenues, deficits, or spending that would be subject to appropriation. [The Congressional Budget Office] also has not completed its analysis of all of the mandates that the bill might impose on intergovernmental or private-sector entities.”

He says that instead of doing their primary job of estimating costs, Congressional Budget Office experts are spending time with congressional staff drafting the complex bill.

John Goodman, president of the Goodman Institute for Public Policy Research, wrote that the proposed bill is “throwing good money after bad” instead of focusing “on rational reform of existing programs.”

Because entitlements comprise so much of the new spending, Goodman wrote, “The Committee for a Responsible Federal Budget estimates that the full cost is not the $3.5 trillion that has been widely advertised, but at least $5 trillion and possibly as much as $5.5 trillion.”

Apart from direct federal spending, there are other huge costs to the private economy. It would cost about $171 billion in the first year just to provide the salaries and facility spaces to meet the demand for increased subsidized child care, according to an analysis by Tara O’Neill Hayes of American Action Forum.

Blahous’ “A Pictorial Guide to Congress’ Irresponsible Health and Budget Proposals,” shows that the Democrats’ proposed legislation “adds substantially to runaway federal spending that is already outpacing U.S. economic output.”

In a dozen or so charts, Blahous shows how the spending blowout will influence the vast number of affected programs. “In practical terms, the current trend must stop,” he wrote. “No population will tolerate its discretionary income perpetually shrinking to support lawmakers’ addiction to promising bigger health benefits.”

Halloween is the new target date for passage. We should all be scared. When even the Congressional Budget Office is daunted in figuring out how much the monstrous bill would cost, it is way past time to press “pause,” as Sen. Joe Manchin, D-W.Va., pleads.


Sunday, October 17, 2021

The problem hasn't been demand, but supply

As the months drag on, it's increasingly clear that Covid is more of a supply shock than a demand shock to the U.S. economy. Do you remember the endless stories about supply chain problems after the 2007-08 financial crisis? Nope. Neither do I. Because they didn't exist. Did we have soaring prices after 9/11? Nope. Container ship shortages after the dotcom collapse? Of course not.

All the recent crises we've dealt with have been negative demand shocks to the U.S. economy. And that has empowered the Keynesian approach of filling demand drops with government stimulus--or consumer spending, as in the case of 9/11, when President Bush famously told families to go about their lives ("fly on airplanes...travel...Get down to Disney World") in order to keep the economy from worsening. 

So naturally, when Covid hit, and people worried about a second Great Depression, policy makers threw more stimulus at the problem than ever before. But Covid is more and more a supply shock, and one that is actually being worsened by the continual massive efforts to stimulate demand.

Some warned about this: "Demand-side stimulus...would give consumers more cash, but the economy will shrink nonetheless...much stimulus money would end up as personal savings or bid up prices for the products still available in a smaller economy," wrote the Cato Institute's Chris Edwards for The Hill last March. And sure enough, third-quarter GDP looks weak as consumer prices have surged 6% from a year ago, even with households still sitting on over $2 trillion of excess savings.

More stimulus could worsen this situation to the point of crisis, if we haven't reached it already. The supply chain is so fragile that products are routinely, if unpredictably, out of stock, or delayed for so long as to be effectively unavailable. Now the energy supply is being caught up in it. What's more, the stimulus and liquidity-fueled asset price gains have helped to shrink the labor force, already under pressure because of the pandemic, by causing early retirements or removing the incentive to work.
The Port of Los Angeles, one of the busiest ports in the country, will begin operating 24 hours a day and 7 days a week to ease cargo bottlenecks that have led to shortages and higher consumer costs. While the neighboring Port of Long Beach, Calif., also started doing a 24/7 schedule last month, major ports in Europe and Asia have operated around the clock for years. 

The latest change was announced by the White House as it seeks to alleviate supply chain issues ahead of the holidays, though the increase in capacity will require cooperation from major U.S. companies like Walmart (WMT), FedEx (FDX) and UPS (UPS).

The root of the problem goes back to the beginning of the pandemic in spring 2020, when consumer demand slumped and shipping lines canceled sailings between Asia and North America. When demand came back in the summer, there were thousands of empty containers stuck in the U.S., and by the fall of 2020, the West Coast freight networks were bursting at the seams to handle the surge in imports. A wave of COVID-19 cases in Southern California over the winter exacerbated the issue by causing a labor crunch, with docks, warehouses and truckers that handled the cargo unable to find enough workers.

Companies like Amazon (NASDAQ:AMZN), Target (NYSE:TGT), Pottery Barn (NYSE:WSM), Ulta Beauty (NASDAQ:ULTA) and Gap (NYSE:GPS) are even offering discounts - or starting holiday advertising - six weeks before Black Friday. The goal here is to stretch out the year-end shopping season, as supply chain challenges could leave them with empty shelves closer to the holidays. The firms also have a load of goods that they brought in early, but with limited warehouse space available, they need consumers to buy the stuff to top off their cash balances.

According to a RetailMeNot survey of almost 1,100 consumers, 37% of shoppers began their holiday shopping between August and September (if not earlier). Another 22% said they would start shopping in October, while 24% planned to begin in November ahead of Thanksgiving. Americans are expected to spend about $1.3T this holiday season, per the latest forecast from Deloitte, marking a 7% to 9% increase over last year.

Perhaps the way to think about it--and pitch it to the public--now is to promote those policies that will increase or fix the supply side of the economy. Incentivizing people to work (expand the labor force). Helping to keep businesses afloat (grow the "supply"). Lowering the cost of labor. You want an infrastructure bill? How a "war effort" to get the glut of goods through the Port of Los Angeles right now? That would seem to have broad appeal. Tax breaks for truckers? You get the idea.

On the flip side, policies that aren't targeted this way risk worsening the problem and could boomerang as a double-dip downturn, like the U.S. experienced in the early 1980s. Never forget that the point of high prices is to destroy demand, because supply can't keep up. So we face a choice: either increase the supply-side of the U.S. economy, or the demand-side will shrink to meet it.


Thursday, October 14, 2021

Producer price inflation not as hot as expected, jobless claims fall below 300,000 mark

The Producer Price Index (PPI) showed prices at the wholesale level in September rose 0.5% month-over-month (m/m), below the Bloomberg consensus estimate calling for a 0.6% gain, and south of August's 0.7% increase. 

The core rate, which excludes food and energy, gained 0.2% m/m, below estimates of a 0.5% rise and the prior month's 0.6% gain. Y/Y, the headline rate was 8.6% higher, just shy of projections of an 8.7% increase and compared to August's 8.3% gain. The core PPI increased 6.8% y/y last month, south of estimates calling for a 7.1% rise, and following August's 6.7% increase.

Weekly initial jobless claims came in at a level of 293,000 for the week ended October 9, versus estimates of 320,000 and compared to the prior week's upwardly-revised 329,000 level. The four-week moving average fell by 10,500 to 334,250, and continuing claims for the week ended October 2 dropped by 134,000 to 2,593,000, below estimates of 2,670,000. 

The four-week moving average of continuing claims fell by 30,500 to 2,737,750.

The yield on the 2-year note is declining 2 basis points (bps) to 0.35% and the yield on the 10-year note is dipping 1 bp to 1.54%, while the 30-year bond rate is ticking 1 bp higher to 2.05%.

Sunday, October 10, 2021

A Weak Jobs Report: The Devil Is In The Details

Stocks and U.S. Treasurys fell Friday after a weak jobs report added to speculation about the Federal Reserve's plan to taper its bond-buying program. September was the slowest month for job growth this year, with just 194,000 jobs added compared to consensus estimates for a half-million, signaling a slowing of the labor market recovery and perhaps complicating the Fed's decision on when to begin scaling back monetary support. Inflation concerns pushed long-term interest rates higher, with the benchmark 10-year yield rising to 1.61% after adding 15 basis points on the week. But the three major stock market indexes finished modestly higher for the week, recovering from steep early losses after the U.S. Senate agreed to raise the debt ceiling for at least a few more weeks.

The unemployment rate fell, but so did the important labor force participation rate, which has remained within a narrow range of 61.4 percent to 61.7 percent since June 2020. And the number of people who are not in the labor force -- have no job and are not looking for one -- is the highest it's been since March.

The underemployment rate—including total unemployed and those employed part time for economic reasons, along with people who are marginally attached to the labor force—decreased to 8.5% from the prior month's 8.8% rate. Average hourly earnings rose 0.6% m/m, north of projections for a 0.4% increase, and versus August's downwardly-revised 0.4% rise. Y/Y, wages were 4.6% higher, in line with forecasts, or $30.85 per hours.  Finally, average weekly hours rose to 34.8 from August's downwardly-revised 34.6, and versus expectations to come in at 34.7 hours.

Now that most children are back in school and pandemic-related unemployment benefits have ended, more Americans returned to work last month.

The number of employed Americans increased by 526,000 to 153,680,000 in September, the fourth straight monthly increase. At the same time, the number of unemployed Americans fell sharply to 7,674,000 in September, a drop of 710,000 from August.

This produced a 4.8 percent unemployment rate, well below the 5.2 percent in August and the lowest since the pandemic began.

People are classified as unemployed if they do not have a job, have actively looked for work in the prior four weeks, and are currently available for work.

In September, the civilian non-institutional population in the United States was 261,766,000. That included all people 16 and older who did not live in an institution, such as a prison, nursing home or long-term care facility.

Of that civilian non-institutional population, 161,354,000 were participating in the labor force, meaning they either had a job or were actively seeking one during the last month. This resulted in a labor force participation rate of 61.6 percent in September -- down a tenth of a point from the 61.7 percent in the prior two months, and only 0.2 points higher than the 61.4 percent when Biden took office.

The labor force participation rate reached a Trump-era high of 63.4 percent in January 2020, just before the onset of COVID.

The number of Americans counted as not in the labor force -- meaning they didn't have a job and were not looking for one -- rose sharply in September to 100,412,000, up 338,000 from August.

BLS noted that notable job gains occurred in leisure and hospitality, in professional and business services, in retail trade, and in transportation and warehousing. Employment in public education declined over the month.

Among the major worker groups, the unemployment rates for adult men (4.7 percent), adult women (4.2 percent), Whites (4.2 percent), and Blacks (7.9 percent) declined in September.

The jobless rates for teenagers (11.5 percent), Asians (4.2 percent), and Hispanics (6.3 percent) showed little change over the month.

Clearly, the problem with employment has not fully resolved itself, causing shortages in labor, which in turn causes disruption to eh supply chain, which in turn results in inflation. 

Thursday, October 7, 2021

I'm in Debt. How Do I Get Myself Out of This Mess?

 I got this question on Quora today. It's a common question. The answer I provided is below. 

I got into debt young as I didn’t realize how important it was to have a good credit score. How can I get myself out of this mess? I’m worried it’s going to affect future relationships.

You really must to want to be debt-free. There is no other way. It’s a process, of both knowledge of personal finance, and modifying your financial behavior. But it is something you can achieve, if you create a plan and follow the steps of sound financial planning.

I’m going to tell you up front that it will take quit a bit of work and effort on your part, depending on how much debt you have, and what you are willing to do. We had a saying in the military about what needed to be done do accomplish our mission: “Whatever is necessary.” This will be the same kind of thing. So you have to develop the same mindset. Be hungry.

Personal finance is 20 percent knowledge, and 80 percent behavior.

When I started I had more than $50,000 in credit card debt, had two mortgages (one on a rental house that was actually costing me more than I made in rents), and a couple of car payments, along with a student loan. I had more debt than my annual income. But I’ll never forget the moment when I paid off my last car payment to become debt free (I still have one mortgage on the house I live in, but this kind of debt — and only this kind — is allowed.)

I’m retired now. I have more than enough money to do what I want. My last car was a 2-year-old slightly used Impala and I paid cash for it…that was a fun buying experience, I’ll tell you.

Use the following steps as a guideline. I also suggest you purchase a copy of Dave Ramsey’s Total Money Makeover. It is the book I used to get out of debt and stay debt free, with very few exceptions. Best $25 I ever spent. There are others you may find that work also, but this one has been used by millions of people to get out of debt.

  1. Have a plan. Write it down. It should state your goals, when you’d like to reach that goal, and what you will do to reach that goal. Of course, in the beginning you don’t know everything, but it’s a good exercise to start. Writing everything down solidifies it in your mind. And keep updating it as you go. Review it monthly. If you have a partner, you both should agree on it. You’re going to run your household finances as if it were a business.
  2. Start using a budget. This is so important that no matter what else you do, if you don’t consistently and faithfully use a budget, everything else you try to accomplish with either not work or be much more difficult. In the beginning it’s hard. But just make it a habit. There are many sources online and through books to teach you how to make a budget and how to follow it. I still do this. If someone where to ask me, I could tell them off the top of my head what my monthly income and expenses are, within $100. Some people don’t know how much money they have at any point in time — avoidance or denial sometimes seems easier — but that is not going to be you.
  3. Learn how to create a Net Worth statement. Basically this is your liabilities (what you owe), minus your assets (what you own). It is a great way to track your progress. You may start out with a negative Net Worth, but that will change. One note: I never use my personal property, such as furniture and/or automobiles in my assets. These are depreciating assets (they lose their value over time). I only use my home value, my investments and my cash in my assets.
  4. Have an emergency fund. Nothing can blow up a well-written plan than not having an emergency fund. So I repeat: Have an emergency fund. Having a credit card is NOT an emergency fund. You never know when an unexpected expense will appear, and having to use more debt goes against everything you’re working toward. Ramsey suggests starting with $1,000 before moving on to other steps. That may not be enough in today’s world. But you have to start somewhere, so if you don’t have one yet, shoot for $1,000 to start. But always be working on it. Your goal should be at least three months’ of living expenses. I keep six months of living expenses in my checking accounts. I know, I’m not earning much if any interest, but the funds are immediately available. I don’t worry about my air conditioner or water heater blowing up, my car breaking down, or anything else I guess.
  5. Now we start on the debt, and most start with credit card (or consumer debt) because it is the most costly. Then move on to car payments or other debt, such as student loans. There are two different methods of attacking this debt: snow-ball method and the high-interest rate method.
    1. I used the snow-ball method, because it has a psychological component to it. You make a list of your debts (I put mine on my refrigerator) and pay the smallest one first. Make minimum payments on all the others, using the most funds you have to pay off the first one. Then cross it off when it’s paid. That is success. Then attack the second one (using the money you paid on the first, also. You don’t get to celebrate yet). Keep going until they are all paid. You’ll be surprised how fast this can go if you don’t waiver.
    2. The other method has you order your debts by the interest rate. Paying the highest interest rate debt first, then the second highest, and so on. This can work, but the reward can be delayed depending the amount of each debt. I think this method can require a little more patience and self-discipline, but if you have those, it can save you some money in overall interest payments. You have to decide which one is for you.
  6. Invest wisely. While you’re paying down your debt, you should be learning how to invest. When your debts are paid, you’re going to have a lot more extra cash, and you’ll want to put that into some solid, long-term investments, with an eye on a nice retirement. I’m retired now, and I’m glad I did these steps before I retired. I have enough money to do what I want now. But complete that emergency fund and get those debts paid before you get too serious about this step.
  7. Save at least 10 percent of what you earn, first. This should always be part of your plan. When you’re working on the first five steps here, this may be hard, but have it as a goal. After I became debt free, I was able to save 20 percent of my income, and my retirement fund just went crazy. A nice crazy.

I have a link to my blog, and the steps I’ve outlined, with some videos to get you started. Make it an adventure, and you’ll never look back.

Six Steps to Financial Freedom


Top Five Consumer Cyber Security FAQs

By Equifax Business, technology, environmental and economic changes are a part of life, and they are coming faster all the time. All of thes...